Cambridge IELTS 13 Test 3 Writing Task 1: Electricity Bar Chart
Cambridge IELTS 13 · Test 3 · Academic Writing Task 1Bar chart
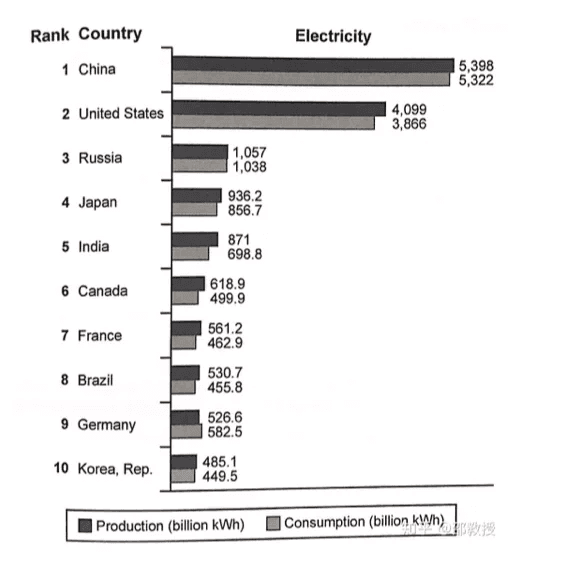
The bar chart shows how much electricity the ten leading countries produced and consumed in 2014. Figures are given in billion kilowatt hours (kWh), and the countries are ranked from China in first place to the Republic of Korea in tenth.
The question
You should spend about 20 minutes on this task. The bar chart below shows the top ten countries for the production and consumption of electricity in 2014. Summarise the information by selecting and reporting the main features and make comparison where relevant. Write at least 150 words.
Free and timed, with a live word count, just like the computer-delivered test. Then get an instant AI band score.
The exam simulator runs on a computer. Open this page on a laptop or desktop to practise.
Key features to report
- China and the United States are far ahead of every other country: China produced 5,398 and consumed 5,322 billion kWh, and the US produced 4,099 and consumed 3,866 billion kWh.
- Russia is a distant third at 1,057 billion kWh produced and 1,038 consumed, which is only about a fifth of China's figures; it is the only other country above 1,000 billion kWh.
- Japan (936.2 produced, 856.7 consumed) and India (871 produced, 698.8 consumed) come next, with India showing a large gap of over 170 billion kWh between production and consumption.
- The remaining five countries are tightly grouped between about 450 and 620 billion kWh: Canada 618.9 and 499.9, France 561.2 and 462.9, Brazil 530.7 and 455.8, Germany 526.6 and 582.5, and Korea 485.1 and 449.5.
- Germany is the only country that consumed more electricity than it produced (582.5 against 526.6 billion kWh); all the others produced more than they used.
- There is a single year (2014), so there are no trends over time; the answer must compare countries and the balance between production and consumption.
Model overview
Overall, China and the United States were by far the largest producers and consumers of electricity in 2014, with the other eight countries trailing well behind. In almost every country production exceeded consumption, Germany being the only exception.
Paragraph plan
- 1
Introduction
Paraphrase the task: the chart compares the amount of electricity generated and used by the ten leading countries in 2014, measured in billion kWh.
- 2
Overview
Make two general points without figures: China and the US dominate both production and consumption, and nearly every country produced more than it consumed, Germany being the only exception.
- 3
Body paragraph 1: the top five
Give the figures for China (5,398 and 5,322) and the US (4,099 and 3,866), then show the big drop to Russia (1,057 and 1,038), Japan (936.2 and 856.7) and India (871 and 698.8), noting India's large surplus.
- 4
Body paragraph 2: the bottom five and Germany
Explain that Canada, France, Brazil, Germany and Korea all produced roughly 485-620 billion kWh and consumed about 450-580 billion kWh. Give Canada's 618.9 and Korea's 485.1 as the range, then highlight Germany, which consumed 582.5 but produced only 526.6.
Useful comparisons
- Group China and the US as the two giants whose combined production is far greater than that of the other eight countries combined.
- Compare China with Russia: Russia's output was only about a fifth of China's.
- Group the countries from sixth to tenth together because their figures are very close.
- Contrast the countries with the biggest surplus of production over consumption, such as the US (about 233 billion kWh) and India (about 172 billion kWh), with those where the two are almost equal, such as Russia and China.
- Single out Germany as the only country with a deficit, consuming about 56 billion kWh more than it produced.
- Note that Germany ranks ninth for production but would rank sixth for consumption.
Band 8+ model answer
207 words · An original model answer written for ieltswrites, not an official answer. It stays in English, as in the exam.
The bar chart compares the amount of electricity generated and used by the ten leading countries in 2014, measured in billion kilowatt hours (kWh).
Overall, China and the United States were by far the largest producers and consumers of electricity, with the remaining eight countries trailing a long way behind. In addition, almost every country produced more electricity than it consumed, Germany being the sole exception.
China topped the ranking, generating 5,398 billion kWh and using 5,322 billion kWh. The United States came second, with production and consumption of 4,099 and 3,866 billion kWh respectively. Russia was a distant third, producing just over 1,000 billion kWh and using a similar amount, which was only about a fifth of China's figures. Japan and India followed, producing 936.2 and 871 billion kWh, although India consumed considerably less than it generated, at 698.8 billion kWh.
The figures for the bottom five countries were tightly grouped. Their output ranged from 618.9 billion kWh in Canada to 485.1 billion kWh in the Republic of Korea, and their consumption was mostly between about 450 and 500 billion kWh. Germany, however, was the only nation to use more electricity than it produced, consuming 582.5 billion kWh compared with an output of 526.6 billion kWh.
Why this answer scores highly
- Task Achievement
- The overview identifies the dominance of China and the US and the general surplus of production over consumption, and the body selects accurate figures for the leaders, the middle group and the Germany exception rather than listing every value.
- Coherence and Cohesion
- Countries are grouped by size, the top five then the bottom five, and cohesive devices such as respectively, by contrast and the sole exception link the comparisons clearly.
- Lexical Resource
- Production and consumption are paraphrased with generated, output, used and surplus, and comparison phrases such as a distant third and trailed well behind add precision.
- Grammatical Range and Accuracy
- The answer uses comparatives and superlatives, respectively constructions, participle clauses such as generating 5,398 billion kWh and a contrastive however to mark the Germany exception, all with accurate past tense verbs.
Useful vocabulary
- billion kilowatt hours
- the unit of electrical energy used in the chart, written billion kWh
- generate electricity
- produce electricity; a synonym for production
- electricity consumption
- the amount of electricity used
- output
- the amount produced
- surplus
- an amount by which production is larger than use
- shortfall
- an amount by which production is smaller than use
- by far the largest
- much larger than all the others
- a distant third
- in third place but a long way behind the first two
- trail behind
- be at a much lower level than others
- tightly grouped
- having figures that are very close to each other
- the sole exception
- the only case that does not follow the general pattern
- exceed
- be greater than
- roughly a fifth of
- about 20% of another figure
- respectively
- in the same order as the items just mentioned
Common mistakes
- Describing increases and decreases, such as electricity production rose from China to Korea; the chart shows one year only, so there is no trend over time.
- Listing all twenty figures one country at a time, which leaves no room for comparison and makes the answer too long.
- Missing Germany, the only country whose consumption was higher than its production, which is the most important exception on the chart.
- Omitting the unit or writing kWh instead of billion kWh, which misreports every figure.
- Using the future or present tense; 2014 is in the past, so past simple is required.
- Leaving out an overview that states China and the US dominate both measures.
Frequently asked questions
- Which Cambridge book is this question from?
- This bar chart of electricity production and consumption in the top ten countries in 2014 is Writing Task 1 of Test 3 in Cambridge IELTS 13 Academic, published in 2018.
- Do I need to mention all ten countries?
- You should cover all of them, but not individually in detail. Give exact figures for the leaders and for Germany, and summarise the closely grouped bottom five with a range.
- Which tense should I use for this chart?
- Use the past simple, because the data refers to 2014. There is no change over time, so focus on comparisons rather than trend verbs.
- How many words should I write for this Task 1?
- Write at least 150 words; about 170-200 words is enough to cover the overview and the main comparisons in around 20 minutes.
Free and timed, with a live word count, just like the computer-delivered test. Then get an instant AI band score.
The exam simulator runs on a computer. Open this page on a laptop or desktop to practise.