Cambridge IELTS 17 Test 4 Writing Task 1: Shop Closures Graph
Cambridge IELTS 17 · Test 4 · Academic Writing Task 1Line graph
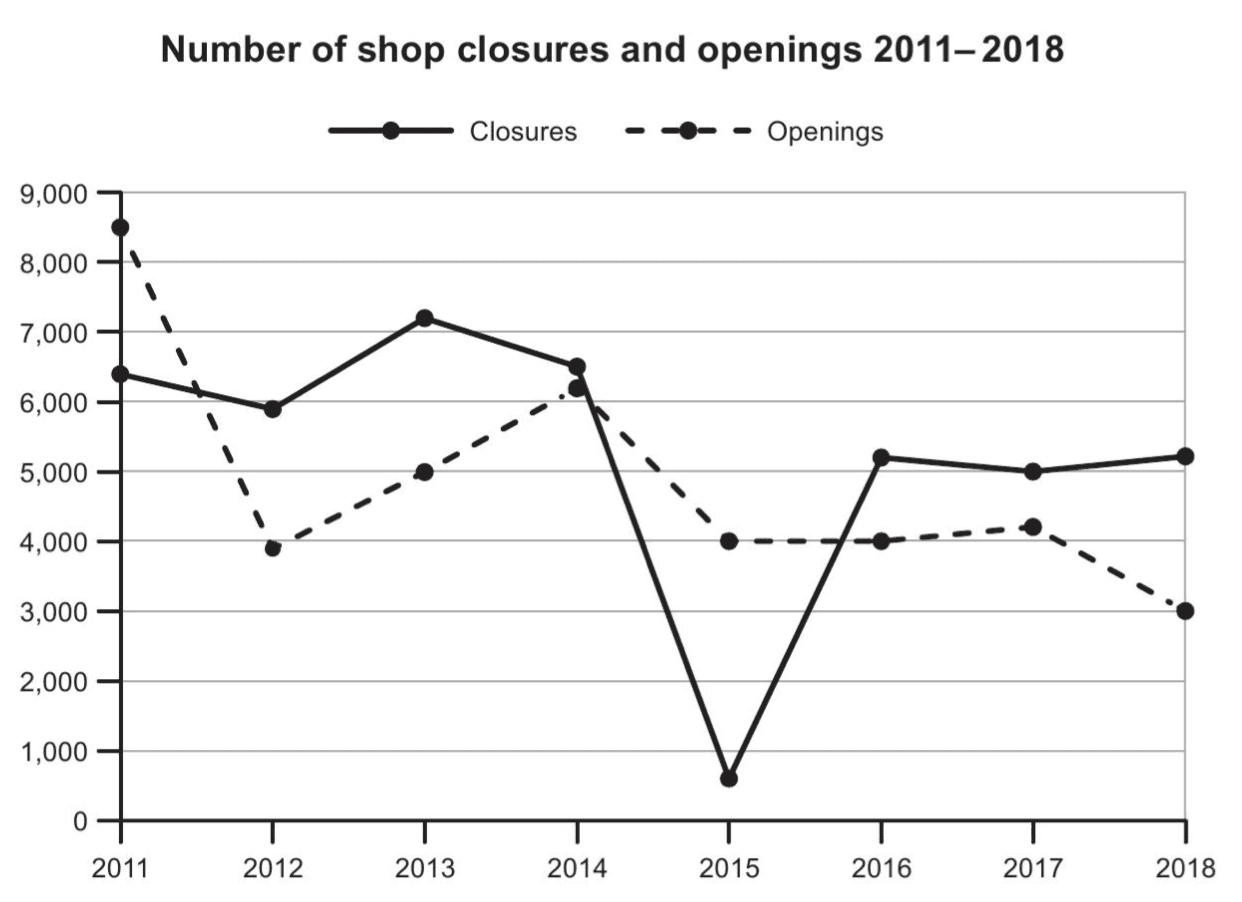
The line graph shows the number of shops that closed and the number of new shops that opened in one country each year between 2011 and 2018. The figures are given as numbers of shops, on a scale from 0 to 9,000.
The question
You should spend about 20 minutes on this task. The graph below shows the number of shops that closed and the number of new shops that opened in one country between 2011 and 2018. Summarise the information by selecting and reporting the main features, and make comparisons where relevant. Write at least 150 words.
Free and timed, with a live word count, just like the computer-delivered test. Then get an instant AI band score.
The exam simulator runs on a computer. Open this page on a laptop or desktop to practise.
Key features to report
- Closures were higher than openings in six of the eight years; openings were higher only in 2011 (about 8,500 against about 6,400) and 2015 (4,000 against about 600).
- Openings started at the highest point on the graph, about 8,500 in 2011, then fell sharply to just under 4,000 in 2012 before recovering to about 6,200 in 2014.
- Closures fluctuated between about 5,900 and 7,200 from 2011 to 2014, peaking at about 7,200 in 2013, and were only slightly above openings in 2014 at about 6,500.
- The most striking feature is the dramatic fall in closures to only about 600 in 2015, the lowest figure on the graph, followed by a rebound to about 5,200 in 2016.
- From 2016 to 2018 closures were fairly stable at around 5,000-5,200, while openings stayed at about 4,000 before dropping to 3,000 in 2018.
- Both figures were lower in 2018 than in 2011, but openings fell much further, from about 8,500 to 3,000.
Model overview
Overall, the numbers of shop closures and openings both fluctuated considerably, but closures outnumbered openings in every year except 2011 and 2015. Both figures were lower at the end of the period than at the start, with openings showing the more significant decline.
Paragraph plan
- 1
Introduction
Paraphrase the task: the line graph shows how many shops closed and how many new shops opened in one country each year from 2011 to 2018.
- 2
Overview
State without figures that both lines fluctuated, closures were higher in all years except 2011 and 2015, and both ended lower than they started, especially openings.
- 3
Body paragraph 1: 2011 to 2015
Report openings at about 8,500 in 2011 against about 6,400 closures, the fall in openings to just under 4,000 in 2012 and recovery to about 6,200 in 2014, the peak in closures of about 7,200 in 2013, and the collapse in closures to about 600 in 2015.
- 4
Body paragraph 2: 2016 to 2018
Describe closures returning to a stable level of about 5,000-5,200, openings staying at about 4,000 until 2017 and falling to 3,000 in 2018, so closures exceeded openings by more than 2,000 in the final year.
Useful comparisons
- Compare the two lines year by year to find where they cross: openings were higher in 2011, closures took over from 2012, openings were higher again in 2015, and closures led from 2016.
- Identify the extremes: the highest point is openings in 2011 at about 8,500, and the lowest is closures in 2015 at about 600.
- Divide the period into two phases: a volatile period from 2011 to 2015 and a more stable period from 2016 to 2018.
- Compare the start and end points: closures fell from about 6,400 to about 5,200, while openings fell much more steeply from about 8,500 to 3,000.
- Point out that the two figures were closest in 2014, at about 6,500 closures and 6,200 openings.
- Note that 2015 is an exception for closures and should be described clearly, since it breaks the general pattern.
Band 8+ model answer
183 words · An original model answer written for ieltswrites, not an official answer. It stays in English, as in the exam.
The line graph shows how many shops closed and how many new shops opened in one country each year between 2011 and 2018.
Overall, both figures fluctuated considerably, but closures outnumbered openings in every year except 2011 and 2015. Both were lower at the end of the period than at the start, with openings showing the more significant decline.
In 2011, around 8,500 shops opened, while about 6,400 closed. Openings then plunged to just under 4,000 in 2012, and although they recovered to roughly 6,200 in 2014, they remained below closures, which peaked at about 7,200 in 2013 and stood at around 6,500 a year later. The most striking change occurred in 2015, when the number of closures collapsed to only about 600, the lowest figure on the graph, whereas openings fell to 4,000.
From 2016 onwards, closures returned to a fairly stable level of between 5,000 and just over 5,200 a year. Openings, on the other hand, stayed at about 4,000 until 2017 before declining to 3,000 in 2018, meaning that closures exceeded openings by more than 2,000 in the final year.
Why this answer scores highly
- Task Achievement
- The answer gives a clear overview of the overall relationship between closures and openings and the downward movement of both, then reports the key highs, lows and crossing points with accurate approximate figures.
- Coherence and Cohesion
- Dividing the period into 2011-2015 and 2016-2018 creates a logical structure, and linkers such as however, whereas and from 2016 onwards make the comparisons easy to follow.
- Lexical Resource
- A range of precise trend vocabulary such as plunged, peaked, collapsed and fairly stable is used, and approximation language such as just under and roughly is applied appropriately.
- Grammatical Range and Accuracy
- The answer uses the past simple accurately with complex sentences, including concessive clauses with although, relative clauses and participle phrases, without errors.
Useful vocabulary
- shop closures
- cases of shops shutting down permanently
- new openings
- shops that start trading for the first time
- outnumber
- be greater in number than something else
- fluctuate
- rise and fall repeatedly
- plunge
- fall suddenly and by a large amount
- collapse
- fall dramatically to a very low level
- rebound
- rise again quickly after a fall
- peak at
- reach the highest point before falling
- level off
- stop rising or falling and stay at about the same level
- the retail sector
- the part of the economy made up of shops
- a net loss
- a situation where more are lost than gained overall
- just under
- slightly less than a figure, useful for values between gridlines
- the lowest point on the graph
- the smallest value shown anywhere in the chart
Common mistakes
- Missing the dramatic fall in closures to about 600 in 2015, the most striking feature of the graph.
- Writing that openings were always lower than closures, when openings were higher in 2011 and 2015.
- Misreading values, for example giving 2012 openings as 4,500 instead of just under 4,000.
- Describing each line separately year by year without comparing closures and openings.
- Speculating about causes, such as online shopping or an economic crisis, which the graph does not show.
- Confusing the units and writing about percentages of shops instead of numbers of shops.
Frequently asked questions
- Which Cambridge book is this question from?
- This line graph about the number of shop closures and openings in one country between 2011 and 2018 is Writing Task 1 of Test 4 in Cambridge IELTS 17 Academic, published in 2022.
- Should I explain why so few shops closed in 2015?
- No. The graph gives no reasons, so simply report the figure accurately and highlight it as the most unusual feature. Adding causes is speculation and does not improve your score.
- Do I need to mention every figure on the graph?
- No. There are 16 data points, so focus on the highest and lowest values, the years when openings exceeded closures, and the start and end figures.
- How many words should I write for this Task 1?
- Write at least 150 words; around 170-200 words is enough to include an overview and the key comparisons in about 20 minutes.
Free and timed, with a live word count, just like the computer-delivered test. Then get an instant AI band score.
The exam simulator runs on a computer. Open this page on a laptop or desktop to practise.