Cambridge IELTS 10 Test 3 Writing Task 1: UK Graduates Bar Charts
Cambridge IELTS 10 · Test 3 · Academic Writing Task 1Bar chart
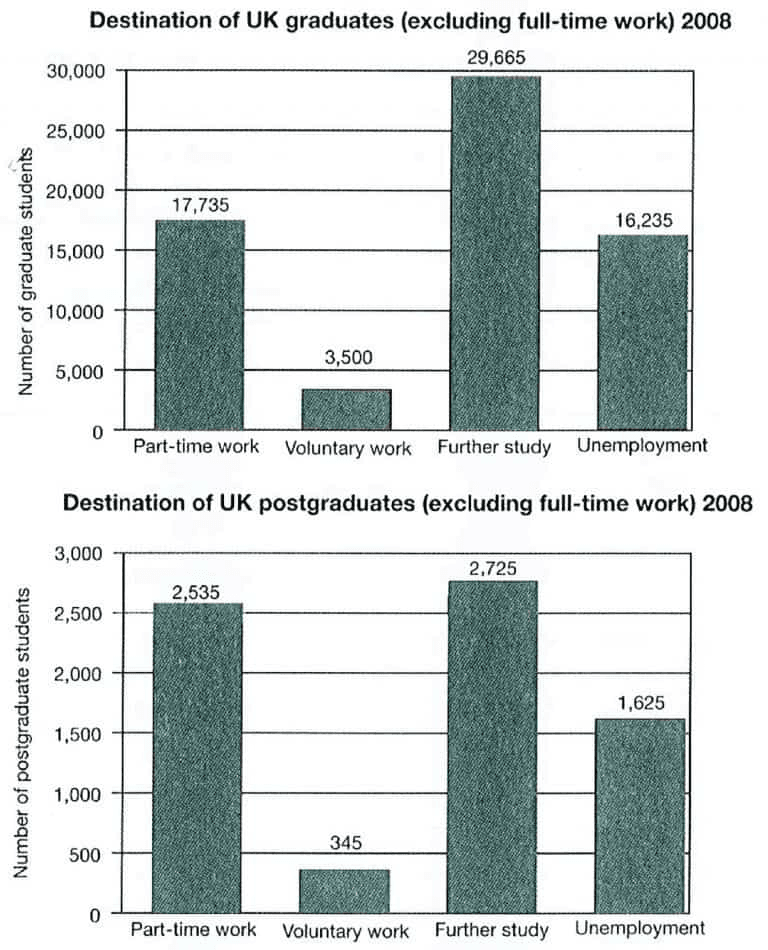
The two bar charts show what UK graduates and postgraduates who did not go into full-time work did after leaving college in 2008. Each chart gives the number of students in four destinations: part-time work, voluntary work, further study and unemployment. The graduate chart has a scale up to 30,000, while the postgraduate chart goes up to only 3,000.
The question
You should spend about 20 minutes on this task. The charts below show what UK graduate and postgraduate students who did not go into full-time work did after leaving college in 2008 Summarise the information by selecting and reporting the main features, and make comparisons where relevant. Write at least 150 words.
Free and timed, with a live word count, just like the computer-delivered test. Then get an instant AI band score.
The exam simulator runs on a computer. Open this page on a laptop or desktop to practise.
Key features to report
- Further study was the most common destination in both groups: 29,665 graduates and 2,725 postgraduates.
- Voluntary work was the least common destination in both groups, with 3,500 graduates and only 345 postgraduates.
- Part-time work was the second most common choice for both groups (17,735 graduates and 2,535 postgraduates).
- Unemployment affected 16,235 graduates, almost as many as those in part-time work, but only 1,625 postgraduates, far fewer than the postgraduates in part-time work.
- The proportions differ: among graduates, further study clearly outnumbered part-time work, whereas among postgraduates the two figures were very close (2,725 and 2,535).
- The scales are different, so the graduate figures are between about seven and eleven times larger than the postgraduate figures (about ten times for voluntary work, further study and unemployment); the numbers should be compared carefully rather than by bar height.
Model overview
Overall, further study was the most popular option and voluntary work the least popular for both graduates and postgraduates, while graduates greatly outnumbered postgraduates in every category. Part-time work and further study were almost equally common among postgraduates, but further study was clearly the leading choice for graduates.
Paragraph plan
- 1
Introduction
Paraphrase the task in one sentence: the bar charts show the destinations of UK graduates and postgraduates who did not enter full-time employment after leaving college in 2008.
- 2
Overview
Without figures, state that further study was the most common choice and voluntary work the least common in both groups, and that graduates far outnumbered postgraduates in every category.
- 3
Body paragraph 1: graduates
Report further study (29,665) as the clear leader, then part-time work (17,735) and unemployment (16,235) at similar levels, and voluntary work (3,500) far behind.
- 4
Body paragraph 2: postgraduates
Report further study (2,725) and part-time work (2,535) as almost equal, unemployment noticeably lower at 1,625 and voluntary work at just 345, comparing each pattern with the graduates.
Useful comparisons
- Describe each group in its own body paragraph, but compare the patterns of the two groups inside the second paragraph.
- Contrast the size of the two groups: most graduate figures are about ten times the matching postgraduate figure, but for part-time work the ratio is only about seven to one.
- Compare further study with part-time work: a gap of about 12,000 for graduates, but fewer than 200 for postgraduates.
- Compare unemployment with part-time work: almost equal for graduates (16,235 and 17,735), but clearly lower for postgraduates (1,625 and 2,535).
- Group voluntary work as the least common option in both charts and deal with it in one sentence per group.
- Keep in mind the chart titles: these students are only those who did not go into full-time work, so do not describe them as all UK graduates.
Band 8+ model answer
179 words · An original model answer written for ieltswrites, not an official answer. It stays in English, as in the exam.
The bar charts show what UK graduates and postgraduates who did not enter full-time employment did after leaving college in 2008.
Overall, further study was the most popular option and voluntary work the least popular in both groups. In every category, graduates greatly outnumbered postgraduates, and while further study was clearly the leading choice for graduates, it was almost on a par with part-time work among postgraduates.
Among graduates, 29,665 pursued further study, far more than in any other category. Part-time work was the next most common destination, with 17,735 graduates, and a similar number, 16,235, were out of work. Only 3,500 graduates did voluntary work.
The postgraduate figures were much smaller, and their pattern differed in two respects. Although further study was again the most common choice, at 2,725, it was only slightly ahead of part-time work, which was taken up by 2,535 postgraduates. Moreover, unemployment was noticeably lower than part-time work in this group, at 1,625, whereas the two figures were close for graduates. As with graduates, voluntary work lagged far behind, attracting a mere 345 postgraduates.
Why this answer scores highly
- Task Achievement
- The answer gives a clear overview of the most and least common destinations and the difference in group size, and it reports every key figure accurately while comparing the two groups' patterns.
- Coherence and Cohesion
- One paragraph is devoted to each group, and the postgraduate paragraph refers back to the graduate figures, with linkers such as by comparison, while and similarly creating clear connections.
- Lexical Resource
- The categories are paraphrased naturally with phrases such as pursued further study, took up part-time jobs and were out of work, and comparison language such as on a par with and lagged far behind is used accurately.
- Grammatical Range and Accuracy
- The answer uses past tenses consistently, relative clauses, comparative structures and fronted adverbials, all with accurate punctuation of large numbers.
Useful vocabulary
- graduates
- students who have completed a first university degree
- postgraduates
- students who have completed a higher degree, such as a master's or doctorate
- destination
- here, what students did after leaving university
- full-time employment
- a job with normal full working hours; a paraphrase of full-time work
- further study
- continuing education after finishing a course
- voluntary work
- unpaid work done to help others or an organisation
- be out of work
- be unemployed
- pursue further study
- choose to continue studying
- take up part-time work
- start a job with fewer hours than a full-time one
- the most popular option
- the choice made by the largest number of people
- roughly ten times
- about ten times as many
- almost on a par with
- nearly equal to
- lag far behind
- be much lower than the others
Common mistakes
- Comparing the bar heights directly, which suggests postgraduates were as numerous as graduates, instead of noticing that the vertical scales differ by a factor of ten.
- Writing that most UK graduates went into further study, when the charts exclude everyone who went into full-time work.
- Turning the numbers into percentages of all graduates, which cannot be calculated from these charts.
- Mixing up the order of part-time work and further study for postgraduates, whose figures are very close (2,535 and 2,725).
- Writing numbers incorrectly, for example 29.665 or 29665, instead of 29,665, or describing them as thousands of percent.
- Using the present tense, although the data refer to 2008 and need the past simple.
Frequently asked questions
- Which Cambridge book is this question from?
- These bar charts about UK graduates and postgraduates who did not go into full-time work in 2008 are Writing Task 1 of Test 3 in Cambridge IELTS 10 Academic, published in 2015.
- Why do the two bar charts look similar if the numbers are so different?
- The vertical scales are different: the graduate chart goes up to 30,000, but the postgraduate chart only goes up to 3,000. Always read the axis before comparing bars.
- Should I write the exact numbers or round them?
- The exact numbers are printed above each bar, so you can quote them accurately; rounding a few, such as almost 30,000, is also acceptable and adds variety.
- How many words should I write for this Task 1?
- Write at least 150 words; around 170-200 words is enough to describe both charts and compare them in about 20 minutes.
Free and timed, with a live word count, just like the computer-delivered test. Then get an instant AI band score.
The exam simulator runs on a computer. Open this page on a laptop or desktop to practise.