Cambridge IELTS 20 Test 3 Writing Task 1: Little Chalfont Library
Cambridge IELTS 20 · Test 3 · Academic Writing Task 1Mixed charts
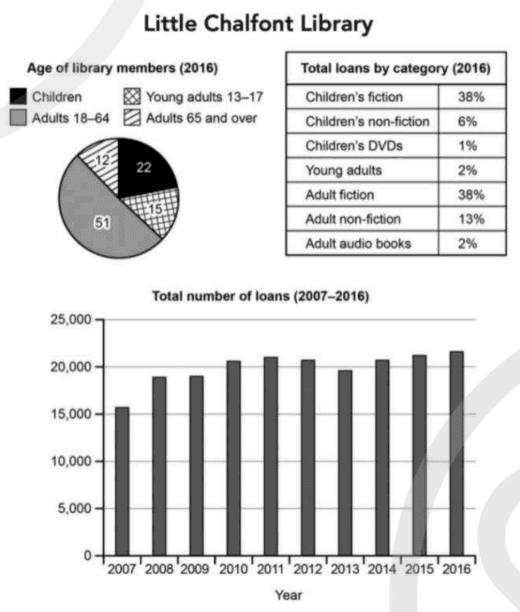
The three visuals give information about the public library in Little Chalfont. A pie chart shows the age groups of library members in 2016 as percentages, a table shows the percentage of total loans in each category in 2016, and a bar chart shows the total number of loans each year from 2007 to 2016.
The question
You should spend about 20 minutes on this task. You should spend about 20 minutes on this task. The charts below give information about a public library in a town called Little Chalfont. Summarise the information by selecting and reporting the main features, and make comparisons where relevant. Write at least 150 words.
Free and timed, with a live word count, just like the computer-delivered test. Then get an instant AI band score.
The exam simulator runs on a computer. Open this page on a laptop or desktop to practise.
Key features to report
- Adults aged 18-64 made up just over half of all members (51%) in 2016, followed by children (22%), young adults aged 13-17 (15%) and adults aged 65 and over (12%).
- Fiction dominated borrowing: children's fiction and adult fiction each accounted for 38% of loans, so together they made up more than three quarters of the total.
- Adult non-fiction was the only other significant category at 13%, while children's non-fiction took 6% and young adults' books, adult audio books and children's DVDs accounted for only 2%, 2% and 1% respectively.
- Young adults were clearly under-represented in borrowing: they made up 15% of members but accounted for just 2% of loans, whereas children, at 22% of members, generated 45% of loans when children's fiction, non-fiction and DVDs are added together.
- Total loans rose overall from just under 16,000 in 2007 to about 21,500 in 2016, with the biggest jump between 2007 and 2008, when the figure rose to about 19,000.
- After passing 20,000 in 2010, loans stayed fairly stable at around 20,000-21,000, apart from a dip to about 19,500 in 2013, and reached their highest level in 2016.
Model overview
Overall, working-age adults made up the largest group of members, and fiction for both children and adults accounted for the vast majority of loans in 2016. The total number of loans rose over the decade, most sharply at the beginning, and then remained broadly stable at a higher level.
Paragraph plan
- 1
Introduction
Paraphrase the task in one sentence: the charts and table provide information about the members of Little Chalfont's public library and the books and other items they borrowed, including annual loans from 2007 to 2016.
- 2
Overview
Give one main point from each visual without figures: adults aged 18-64 were the biggest group of members, fiction made up most loans, and total loans increased over the period, especially at the start.
- 3
Body paragraph 1: members and loan categories in 2016
Give the membership percentages (51%, 22%, 15%, 12%), then the loan figures: 38% each for children's and adult fiction, 13% for adult non-fiction and very small shares for the other categories. Point out that young adults were 15% of members but only 2% of loans.
- 4
Body paragraph 2: total loans 2007-2016
Describe the rise from just under 16,000 in 2007 to about 19,000 in 2008, the move above 20,000 in 2010, the dip to about 19,500 in 2013 and the peak of about 21,500 in 2016.
Useful comparisons
- Link the pie chart and the table: children were 22% of members but children's items made up 45% of loans, suggesting that children borrowed heavily or that parents borrowed for them.
- Contrast young adults' 15% share of membership with their 2% share of loans.
- Group the two fiction categories together (76% of loans) and the five small categories together (24%).
- Combine the two adult age groups (63% of members) and compare them with the three adult loan categories (53% of loans).
- Divide the bar chart into two phases: rapid growth in 2007-2010, then relative stability with a single dip in 2013.
- Use approximate language for the bar chart, such as just under 16,000 and about 21,500, because the bars fall between gridlines.
Band 8+ model answer
210 words · An original model answer written for ieltswrites, not an official answer. It stays in English, as in the exam.
The charts and table provide information about the members of the public library in Little Chalfont and what they borrowed in 2016, together with the total number of loans each year from 2007 to 2016.
Overall, working-age adults formed the largest group of members, and fiction for both children and adults made up the vast majority of loans. The total number of loans increased over the decade, rising most sharply at the start before levelling off.
In 2016, just over half of all members (51%) were adults aged 18 to 64, while children accounted for 22%, young adults for 15% and people aged 65 and over for 12%. Children's fiction and adult fiction were by far the most popular categories, each representing 38% of loans, followed by adult non-fiction at 13%. All other categories had a negligible share, with young adults' books, for example, making up only 2% of loans despite this age group accounting for 15% of members.
Turning to the trend over time, total loans climbed from just under 16,000 in 2007 to about 19,000 in 2008 and passed 20,000 in 2010. After that, the figure remained fairly stable, apart from a slight dip to around 19,500 in 2013, before reaching a peak of approximately 21,500 in 2016.
Why this answer scores highly
- Task Achievement
- The answer covers all three visuals with an overview that draws one main point from each, selects the most significant figures accurately and makes a relevant comparison between membership and borrowing.
- Coherence and Cohesion
- The 2016 data from the pie chart and table are combined in one paragraph and the trend over time in another, with linking such as by contrast, while and in comparison connecting the information logically.
- Lexical Resource
- Precise terms such as working-age adults, made up the bulk of, a negligible share and levelled off avoid repetition of percentage and loans, and approximate values are expressed naturally.
- Grammatical Range and Accuracy
- The answer combines past tenses with comparative and superlative forms, relative and participle clauses and the word respectively, all used accurately.
Useful vocabulary
- library members
- people who are registered to borrow items from a library
- loans
- items such as books or DVDs borrowed from a library
- borrowing
- the activity of taking items from a library for a period of time
- working-age adults
- a useful paraphrase for adults aged 18-64
- senior citizens
- people aged 65 and over
- account for
- make up a particular share of a total
- make up the bulk of
- form the largest part of something
- a negligible share
- a very small, almost unimportant proportion
- under-represented
- making up a smaller share of one total than of another
- respectively
- in the same order as the items just mentioned
- level off
- stop rising or falling and stay at about the same level
- a slight dip
- a small, temporary fall
- the decade
- a period of ten years, here 2007-2016
Common mistakes
- Describing only one or two of the three visuals; all three must be covered, including the bar chart for 2007-2016.
- Treating the pie chart numbers as numbers of people rather than percentages of members.
- Writing that the number of loans increased every year, when it was almost flat in 2008-2009 and fell in 2012 and 2013.
- Listing every category in the table with equal weight instead of highlighting the two fiction categories and grouping the very small ones.
- Missing the useful comparison between membership and borrowing, such as young adults making up 15% of members but only 2% of loans.
- Giving no overview, or an overview that summarises only the bar chart and ignores the pie chart and table.
Frequently asked questions
- Which Cambridge book is this question from?
- This mixed task with a pie chart, a table and a bar chart about Little Chalfont Library is Writing Task 1 of Test 3 in Cambridge IELTS 20 Academic.
- How do I organise an answer with three different charts?
- Write one overview with a key point from each visual, then use two body paragraphs: one for the 2016 data on members and loan categories, and one for the trend in total loans from 2007 to 2016.
- Do I need to mention every loan category in the table?
- No. Focus on the two fiction categories and adult non-fiction, and group the smallest categories together in one short phrase.
- How many words should I write for this Task 1?
- Write at least 150 words; around 180-210 words is usually needed to cover three visuals properly in about 20 minutes.
Free and timed, with a live word count, just like the computer-delivered test. Then get an instant AI band score.
The exam simulator runs on a computer. Open this page on a laptop or desktop to practise.